These are the Cities with the Most Aggressive Drivers in Every State (2022)

Drivers across the country have demonstrated elevated rates of aggressive driving since the start of the pandemic. This year, these are the cities in every state where drivers are especially heated behind the wheel.
Aggressive drivers come in all forms. Whether it’s abruptly cutting off other vehicles, following too closely behind the car in front of them, or turning a blind eye to traffic signals, there’s no shortage of ways aggressive drivers can irritate — and endanger — their fellow motorists.
In recent years, aggressive driving has unfortunately become more normalized on U.S. roads. According to a recent report by Insurify, 44% of drivers reported witnessing more aggressive driving in the past year compared to before the pandemic. Even as traffic levels have more or less returned to pre-pandemic rates, the spike in aggressive driving, initially sparked during early shelter-in-place orders in 2020, has not followed suit.
While cities from coast to coast are seeing elevated aggression on their roads, there are certain regions where drivers are particularly flagrant behind the wheel. To understand where this trend towards aggression is most prevalent, the research team at Insurify turned to their database of over 4.6 million car insurance applications to identify the city in each state with the most aggressive drivers this year.

Composite Score Breakdown
Aggressive driving rate
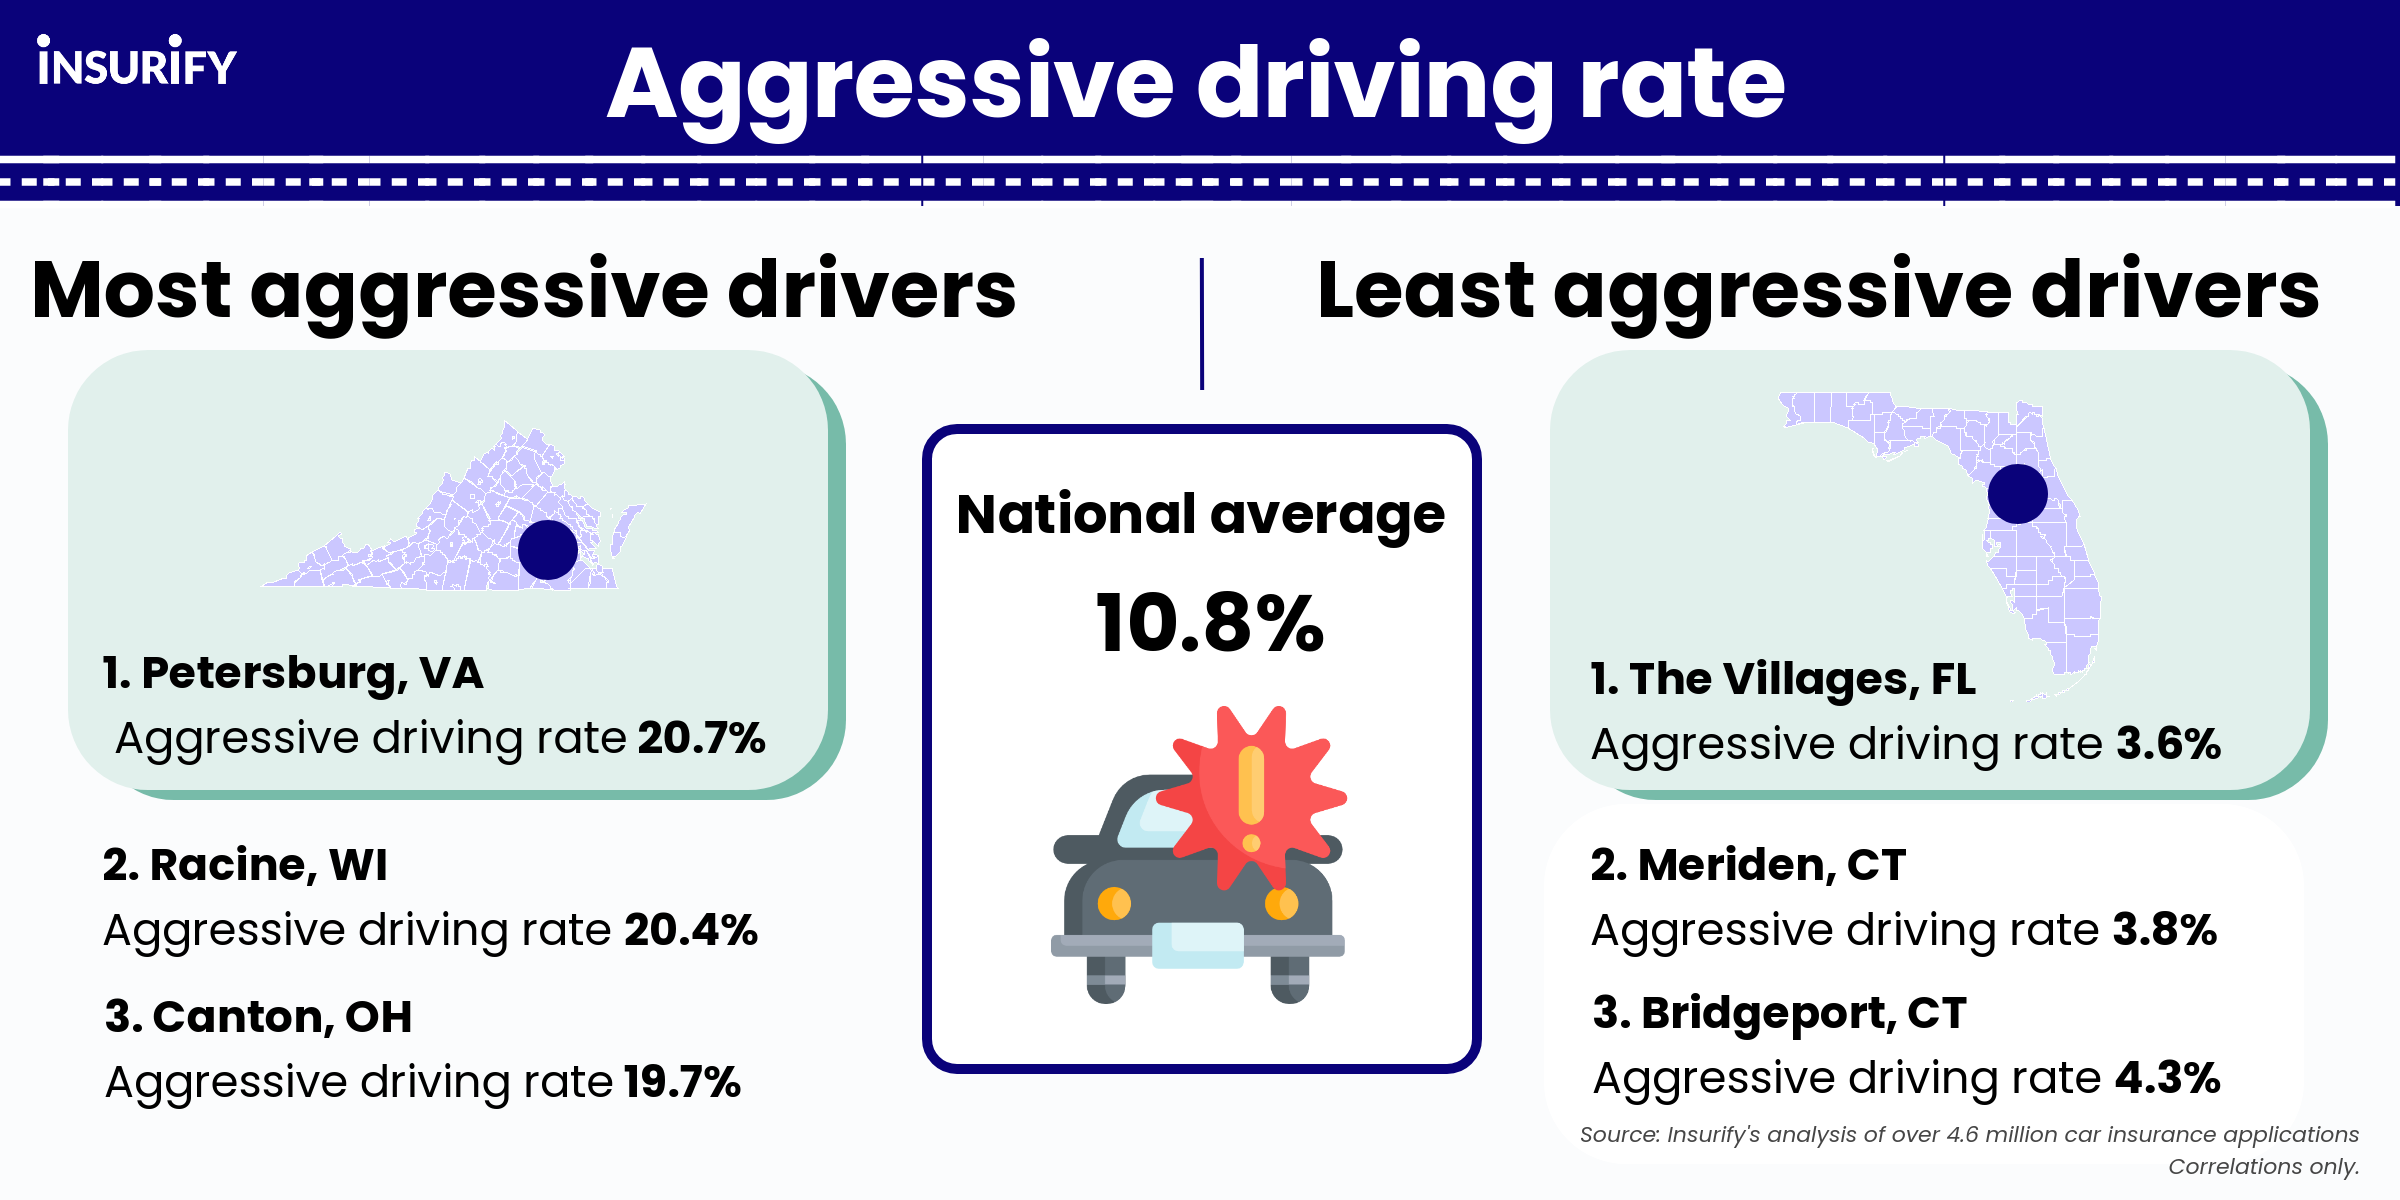
Across the 660 U.S. cities surveyed, on average, 10.8% of drivers have been cited for aggressive driving behavior. Among the top cities in every state, however, the average rate jumps to 14.0%, a whopping 30% greater than the national average. Petersburg, Virginia has the highest aggressive driving rate in the nation. The city with the lowest rate of aggressive driving is The Villages, Florida, with 3.6% of drivers reporting aggressive citations on their record — 66% lower than the national average.

Speeding rate
The most common aggressive driving violation is speeding. Insurify’s data scientists included both exceeding the posted speed limit and driving too fast for conditions when identifying speeding rates across the nation. The average share of drivers with at least one of these speeding infractions on record is 9.5%. At 18.5%, drivers in Kennewick, Washington have the highest speeding rate in the nation, exceeding the national average by 95%. Meriden, Connecticut has the lowest speeding rate in the nation at 3.2%, which is 66% lower than the national average.
Failure to stop rate
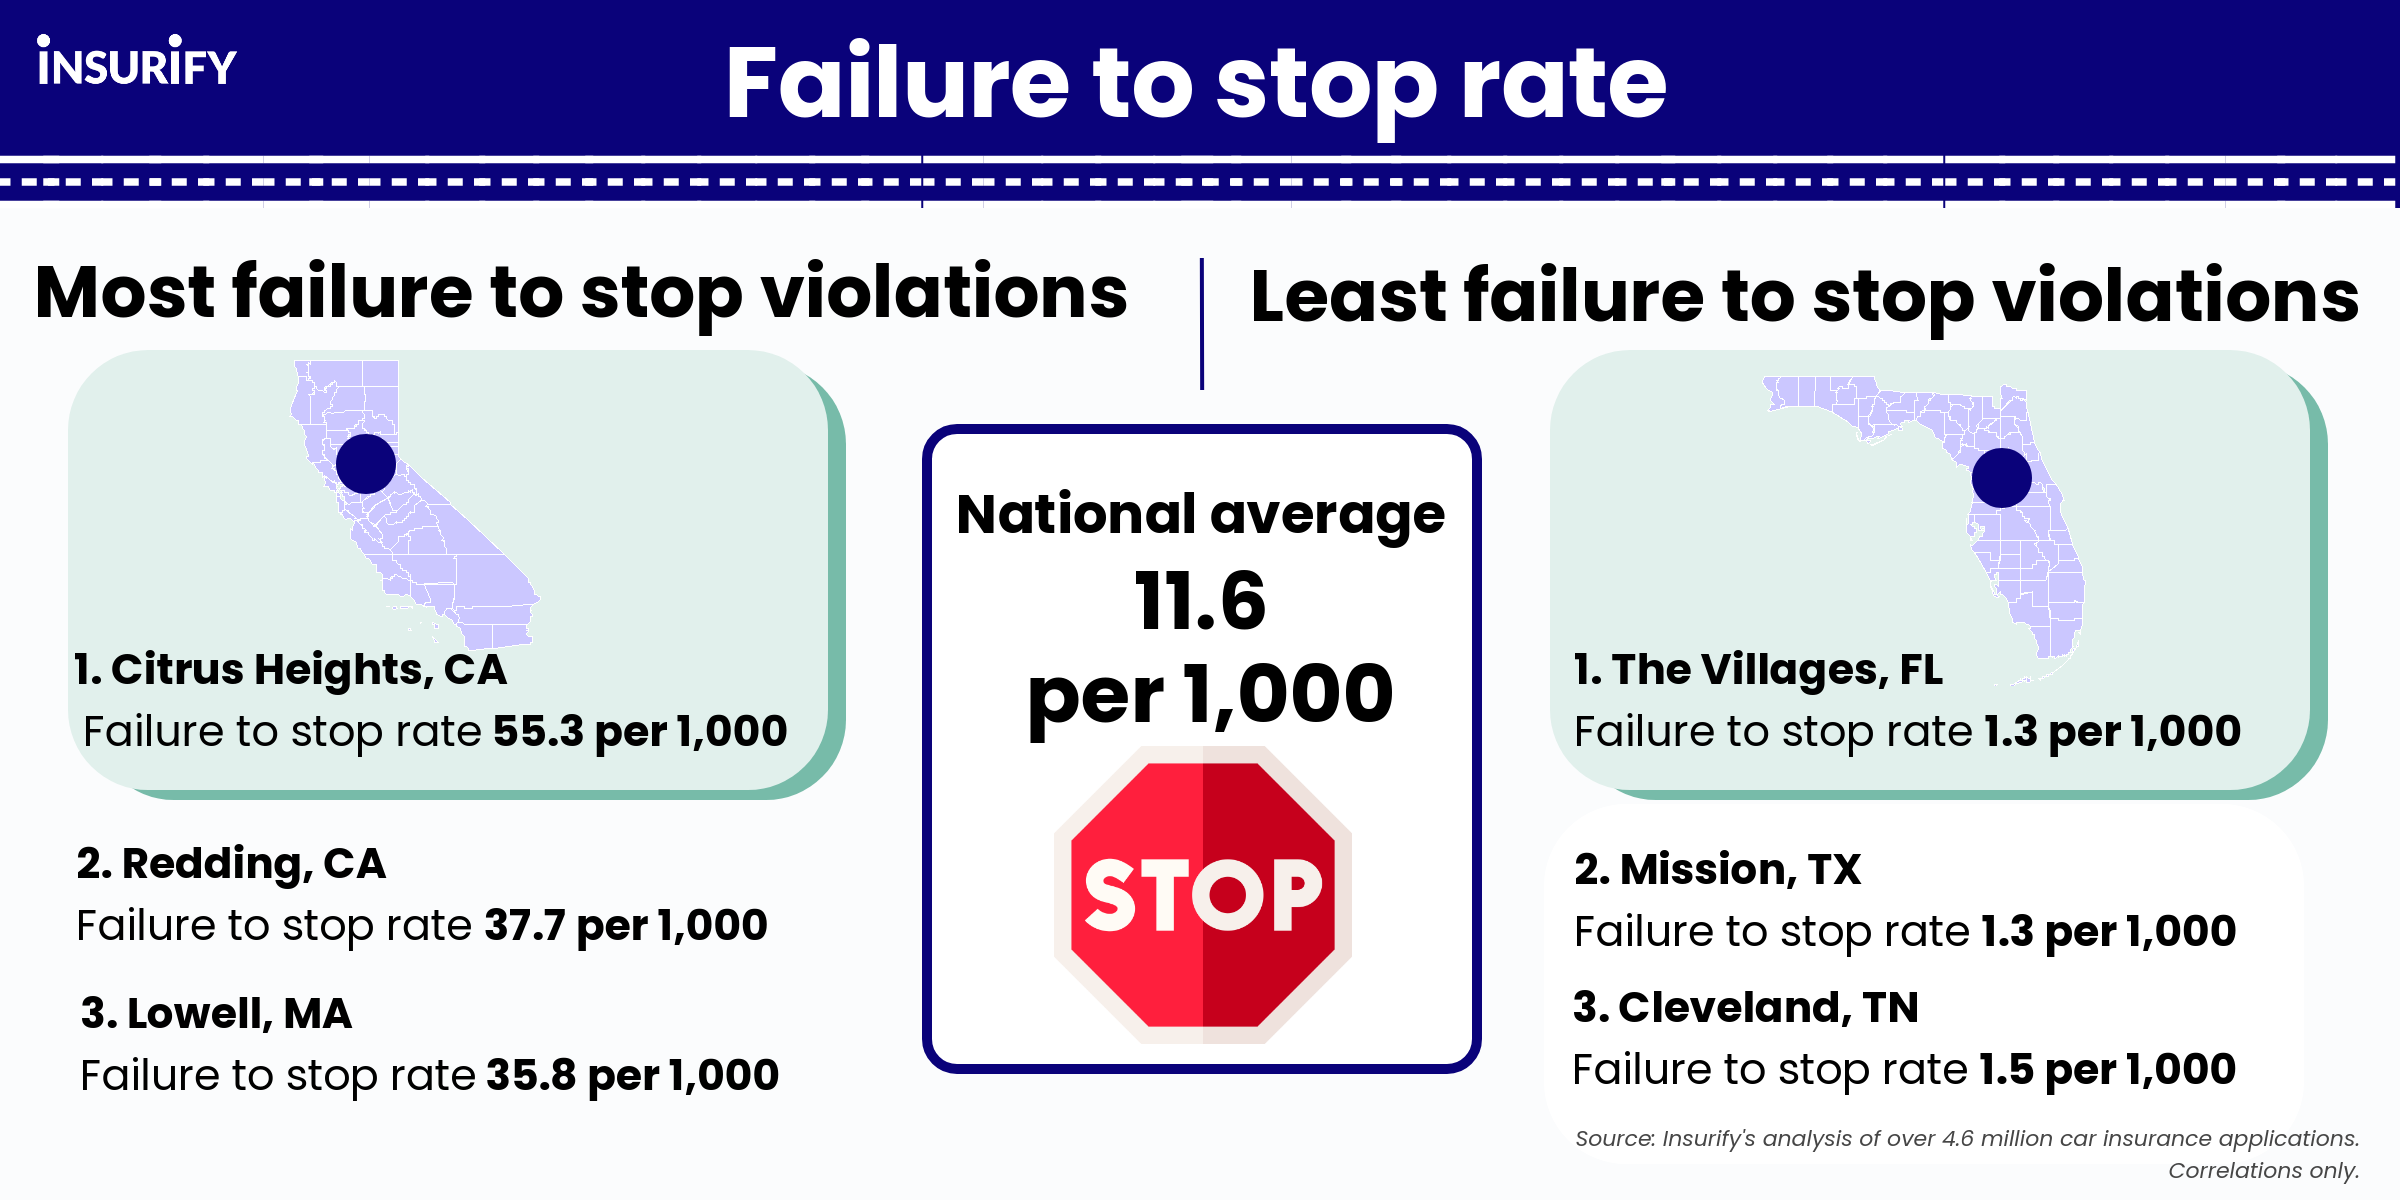
The second most common aggressive driving violation is failure to stop. In this analysis, Insurify’s data scientists included failure to stop at a stop sign, failure to stop at a red light, and failure to stop for a school bus when identifying failure to stop rates. On average, 11.6 per 1,000 drivers reported at least one failure to stop citation across the 660 U.S. cities surveyed. Citrus Heights, California has the highest failure to stop rate in the nation at 55.3 per 1000 drivers, which is a staggering 394% higher than the national average. The Villages, Florida has the lowest nationwide rate at 1.3 per 1,000 drivers, standing 89% lower than the national average.
Failure to yield, reckless driving, tailgating, and passing where prohibited rates
Aggressive driving can come in many forms, even if they occur less frequently. The average failure to yield citation rate across U.S. cities is 40.6 per 10,000 drivers. The average rate of reckless driving is 10.7 per 10,000 drivers. For tailgating and passing where prohibited, the average rate is 8.5 per 10,000 drivers and 6.0 per 10,000 drivers, respectively.
Methodology
The data scientists at Insurify, an auto insurance comparison website, referred to their database of over 4.6 million car insurance applications to identify the city with the most aggressive drivers in each state.
When applying for car insurance, drivers disclose information including their city and state of residence, as well as their driving history, including any moving violations on their record within the last seven years. Insurify’s data scientists classified the following driving violations as the most extreme forms of aggressive driving behavior: speeding (exceeding the posted speed limit, driving too fast for conditions), failure to stop violations (failure to stop for a red light, school bus, or stop sign), failure to yield violations (failure to yield the right of way, failure to yield to a pedestrian), reckless driving, passing where prohibited, and tailgating.
To determine the most aggressive driving cities in the nation, Insurify’s data scientists calculated the share of drivers with one or more aggressive driving violations on their record in 660 U.S. cities. In each state, the city with the highest share of drivers with one or more of these violations on record was identified as having the most aggressive drivers in its respective state. States with insufficient municipal data were excluded from the analysis.
The findings in this article represent statistical trends found in Insurify’s database of over 4.6 million car insurance applications. The findings of this study are not meant to imply the direction nor necessarily the existence of a causal relationship. Rather, this is a presentation of statistical correlations of public interest.

Cities with Most Aggressive Drivers
Petersburg, Virginia is home to the most aggressive drivers in the nation. 20.7% drivers in Petersburg have at least one aggressive driving violation on record, which is not only 31% higher than the Virginia state average, but 92% greater than the national average across all U.S. cities.
The Cities with the Most Aggressive Drivers by State
Alabama: Tuscaloosa
- Share of drivers cited for aggressive behavior: 15.0% (20% more aggressive than state average)
Arizona: San Tan Valley
- Share of drivers cited for aggressive behavior: 14.9% (50% more aggressive than state average)
Arkansas: Fort Smith
- Share of drivers cited for aggressive behavior: 12.7% (23% more aggressive than state average)
California: Oxnard
- Share of drivers cited for aggressive behavior: 14.8% (66% more aggressive than state average)
Colorado: Greeley
- Share of drivers cited for aggressive behavior: 17.4% (19% more aggressive than state average)
Connecticut: Stamford
- Share of drivers cited for aggressive behavior: 7.4% (32% more aggressive than state average)
Delaware: Dover
- Share of drivers cited for aggressive behavior: 12.2% (25% more aggressive than state average)
Florida: Tallahassee
- Share of drivers cited for aggressive behavior: 13.0% (52% more aggressive than state average)
Georgia: Gainesville
- Share of drivers cited for aggressive behavior: 17.2% (34% more aggressive than state average)
Idaho: Boise
- Share of drivers cited for aggressive behavior: 18.7% (22% more aggressive than state average)
Illinois: Springfield
- Share of drivers cited for aggressive behavior: 14.5% (27% more aggressive than state average)
Indiana: Evansville
- Share of drivers cited for aggressive behavior: 13.1% (22% more aggressive than state average)
Iowa: Des Moines
- Share of drivers cited for aggressive behavior: 19.4% (12% more aggressive than state average)
Kansas: Wichita
- Share of drivers cited for aggressive behavior: 15.9% (16% more aggressive than state average)
Kentucky: Frankfort
- Share of drivers cited for aggressive behavior: 11.8% (41% more aggressive than state average)
Louisiana: Lafayette
- Share of drivers cited for aggressive behavior: 9.6% (19% more aggressive than state average)
Maryland: Gaithersburg
- Share of drivers cited for aggressive behavior: 13.3% (11% more aggressive than state average)
Massachusetts: Fall River
- Share of drivers cited for aggressive behavior: 12.4% (33% more aggressive than state average)
Michigan: Flint
- Share of drivers cited for aggressive behavior: 9.4% (6% more aggressive than state average)
Minnesota: Minneapolis
- Share of drivers cited for aggressive behavior: 10.7% (3% more aggressive than state average)
Mississippi: Hattiesburg
- Share of drivers cited for aggressive behavior: 11.1% (19% more aggressive than state average)
Missouri: Columbia
- Share of drivers cited for aggressive behavior: 15.4% (30% more aggressive than state average)
Nebraska: Lincoln
- Share of drivers cited for aggressive behavior: 17.2% (18% more aggressive than state average)
Nevada: Sparks
- Share of drivers cited for aggressive behavior: 10.8% (36% more aggressive than state average)
New Jersey: Trenton
- Share of drivers cited for aggressive behavior: 7.6% (23% more aggressive than state average)
New Mexico: Las Cruces
- Share of drivers cited for aggressive behavior: 11.2% (18% more aggressive than state average)
New York: Schenectady
- Share of drivers cited for aggressive behavior: 10.7% (25% more aggressive than state average)
North Carolina: Jacksonville
- Share of drivers cited for aggressive behavior: 15.7% (30% more aggressive than state average)
Ohio: Canton
- Share of drivers cited for aggressive behavior: 19.7% (16% more aggressive than state average)
Oklahoma: Edmond
- Share of drivers cited for aggressive behavior: 13.1% (18% more aggressive than state average)
Oregon: Salem
- Share of drivers cited for aggressive behavior: 15.8% (23% more aggressive than state average)
Pennsylvania: York
- Share of drivers cited for aggressive behavior: 12.3% (41% more aggressive than state average)
Rhode Island: Pawtucket
- Share of drivers cited for aggressive behavior: 10.6% (17% more aggressive than state average)
South Carolina: North Augusta
- Share of drivers cited for aggressive behavior: 18.6% (28% more aggressive than state average)
Tennessee: Johnson City
- Share of drivers cited for aggressive behavior: 17.3% (36% more aggressive than state average)
Texas: San Angelo
- Share of drivers cited for aggressive behavior: 15.9% (75% more aggressive than state average)
Utah: Orem
- Share of drivers cited for aggressive behavior: 14.6% (7% more aggressive than state average)
Virginia: Petersburg
- Share of drivers cited for aggressive behavior: 20.7% (31% more aggressive than state average)
Washington: Spokane
- Share of drivers cited for aggressive behavior: 16.5% (16% more aggressive than state average)
West Virginia: Charleston
- Share of drivers cited for aggressive behavior: 8.1% (5% more aggressive than state average)
Wisconsin: Racine
- Share of drivers cited for aggressive behavior: 20.4% (18% more aggressive than state average)
If you have any questions or comments about this article or would like to request the data, please contact insights@insurify.com.
More From 103.5 KISS FM

![Ashton Jeanty Speaks Highly Of Boise Coach In New Podcast [Video]](http://townsquare.media/site/737/files/2026/06/attachment-screenshot-2026-06-11-at-11-59-47-am.png?w=980&q=75)


![Boise Hawks Baseball Player Gets Pulled Up To MLB [Video]](http://townsquare.media/site/737/files/2026/06/attachment-screenshot-2026-06-09-at-6-10-41-pm.png?w=980&q=75)
